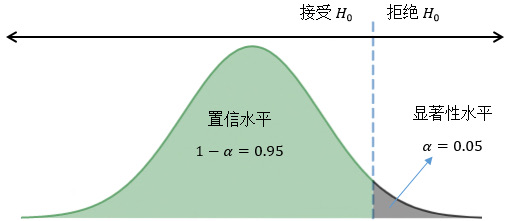
假设检验 
把公认成立的结论作为 $H_0$, 把想要验证的结论作为 $H_1$;目的是排除随机涨落的影响,证明颠覆性的结论、、
表达式的具体形式不重要,不管分子分母,重要的是表达式本身服从的分布和置信区间怎么取
一般的流程: 假设真理→计算真理条件下容许出错的样本空间→落在这个之外的就拒绝

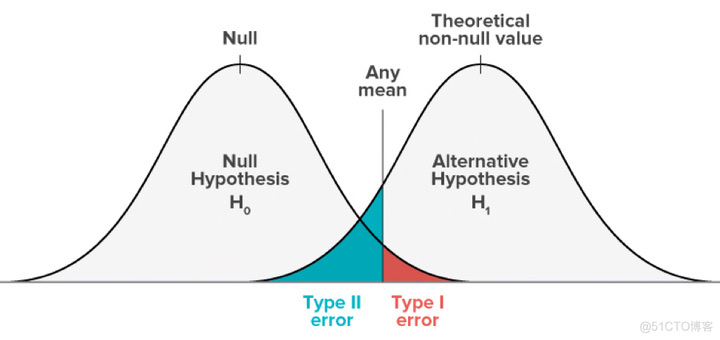
检验错误 

| 拒绝假设 | 接受假设 | |
|---|---|---|
| $H_0$ 正确 | Type Ⅰ error $\alpha$ | $1-\alpha$ |
| $H_1$ 正确 | $1-\beta$ | Type Ⅱ error $\beta$ |
- 一类错误和二类错误无法同时变小
- 通常要求一类错误的概率小
不要老关注平均值,误差才是重要的
import numpy as np
import scipy.stats as st
import matplotlib.pyplot as plt

x=np.linspace(-8,8,200)
pdfa=st.norm.pdf(x,-2,1.5)
pdfb=st.norm.pdf(x,1,1.5)
plt.plot(x,pdfa,x,pdfb)
### 一类错误, 功效函数beta
plt.fill_between(x,pdfa,where=x>=0,alpha=0.3)
### 二类错误, 1-beta
plt.fill_between(x,pdfb,where=x<=0,alpha=0.3)
### 两类错误同时变小不可兼得
<matplotlib.collections.FillBetweenPolyCollection at 0x7fb5dda16ea0>
重要参数检验 
- $H_0: \theta \geq \theta_0, H_1: \theta < \theta_0$
- $H_0: \theta \leq \theta_0, H_1: \theta > \theta_0$
- $H_0: \theta = \theta_0, H_1: \theta \neq \theta_0$
$\theta > \theta_0, \sigma^2$ 已知的检验 
对于任意 $\theta$,根据中心极限定理, $(\bar{\theta}-\theta)/(\sigma/\sqrt{n})$为$N(0,1)$的正态分布
$$ P_{\theta_0}(\bar{\theta} \leq C) = \alpha\\ \Phi((C-\theta_0)/(\sigma/\sqrt{n}))=\alpha\\ C=\theta_0-1.64\sigma/\sqrt{n}, where \ \alpha = 0.05 $$
x=np.linspace(-6,6,200)
pdfa=st.norm.pdf(x,-1,1)
pdfb=st.norm.pdf(x,0,1)
pdfc=st.norm.pdf(x,1,1)

plt.plot(x,pdfa,x,pdfb,x,pdfc)

print(st.norm.ppf(0.05))

#画出一类错误
plt.fill_between(x,pdfc,where=x<-1.64,alpha=0.3)
plt.fill_between(x,pdfb,where=x<-1.64,alpha=0.3)
-1.6448536269514729
<matplotlib.collections.FillBetweenPolyCollection at 0x7fb5dda95b20>
$\theta \leq \theta_0, \sigma^2$ 已知的检验 
$$ C=\theta_0+1.64\sigma/\sqrt{n} $$
x=np.linspace(-6,6,200)
pdfa=st.norm.pdf(x,-1,1)
pdfb=st.norm.pdf(x,0,1)
pdfc=st.norm.pdf(x,1,1)

plt.plot(x,pdfa,x,pdfb,x,pdfc)

print(st.norm.ppf(0.95))

plt.fill_between(x,pdfa,where=x>1.64,alpha=0.3)
plt.fill_between(x,pdfb,where=x>1.64,alpha=0.3)
1.6448536269514722
<matplotlib.collections.FillBetweenPolyCollection at 0x7fb5db75ac60>
假设检验的矛盾 
当 $\theta_0-1.64\sigma/\sqrt{n} \leq \bar{\theta} \leq \theta_0+1.64\sigma/\sqrt{n}$ 时候,两个假设都成立
- $\theta \ge \theta_0$
- $\theta \le \theta_0$
$\theta = \theta_0, \sigma^2$ 已知的检验 
- $|\bar{\theta} - \theta_0|\leq C$
x=np.linspace(-6,6,200)
pdfb=st.norm.pdf(x,0,1)
plt.plot(x,pdfb)

print(st.norm.ppf(0.025))

plt.fill_between(x,pdfb,where=(x>1.96)|(x<-1.96),alpha=0.3)
-1.9599639845400545
<matplotlib.collections.FillBetweenPolyCollection at 0x7fb5db739f10>
$\sigma$ 未知 
假设检验的三种情况
- $H_0 : \theta \geq \theta_0$,$H_1 : \theta < \theta_0$
- $H_0 : \theta \leq \theta_0 $,$H_1 : \theta > \theta_0$
- $H_0 : \theta = \theta_0$,$H_1 : \theta \neq \theta_0$
$\frac{\bar{\theta} - \theta_0}{S/\sqrt{n}}$ 会近似服从 $t_{n-1}$ 分布。
- 左侧检验:$\frac{\bar{\theta} - \theta_0}{S/\sqrt{n}} \geq -t_{n-1}(\alpha)$
- 右侧检验:$\frac{\bar{\theta} - \theta_0}{S/\sqrt{n}} \leq t_{n-1}(\alpha)$
- 双侧检验:$|\frac{\bar{\theta} - \theta_0}{S/\sqrt{n}}| \leq t_{n-1}(\alpha/2)$
# 正态与t的区别:t尾部更厚
x=np.linspace(-6,6,200)
pdfb=st.norm.pdf(x,0,1)
t=st.t.pdf(x,5)
print(st.t.ppf(0.025,5))

plt.plot(x,pdfb,x,t)
plt.fill_between(x,pdfb,where=(x>1.96)|(x<-1.96),alpha=0.3)
plt.fill_between(x,t,where=(x>2.57)|(x<-2.57),alpha=0.3)
-2.5705818356363146
<matplotlib.collections.FillBetweenPolyCollection at 0x7fb5dd97deb0>
其他情况 
- 两个正态分布的均值之差的检验,利用上节课的 $t_{n+m-2} 分布来检验
$$ \sqrt\frac{nm(n+m-2)}{n+m}\frac{\bar{x}-\bar{y} - (\mu_1-\mu_2)}{\sqrt{\sum_{i=1}^{n} (x_i-\bar{x})^2 + \sum_{i=1}^{m} (y_i-\bar{y})^2)}} \propto t_{n+m-2} $$
- 分布的 $\sigma^2$ 与 $\sigma^2_0$ 的比较 , 利用 $\chi^2$ 分布来检验
$$ \frac{(n-1)S^2}{\sigma^2} \propto \chi_{n-1}^2 $$
- 指数分布的均值,使用
$$ 2n\lambda\bar{x}\propto \chi_{2n}^2 $$
$$ \bar{x}< C,lambda>\lambda_0 $$
rv=st.chi2(20)
x=np.linspace(rv.ppf(0.001),rv.ppf(0.999),200)
chi=rv.pdf(x)
l_alpha=rv.ppf(0.05)/20
r_alpha=rv.ppf(0.95)/20
l_alpha_2 = rv.ppf(0.025)/20
r_alpha_2 = rv.ppf(0.975)/20

print(l_alpha,r_alpha,l_alpha_2,r_alpha_2)
print(1/l_alpha,1/r_alpha,1/l_alpha_2,1/r_alpha_2)

plt.plot(x/20,chi)
### x*lambda0<1.57, 1/x>0.64*lambda_0 lambda > lambda_0
plt.fill_between(x/20,chi,where=(x/20>r_alpha),alpha=0.3)
### x*lambda0>0.54, 1/x<1.84*lambda_0 ,lambda < lambda_0
plt.fill_between(x/20,chi,where=(x/20<l_alpha),alpha=0.3)
### 0.47<x*lambda0<1.7, 0.58*lambda_0<1/x<2.08*lambda_0 ,lambda = lambda_0
plt.fill_between(x/20,chi,where=(x/20>r_alpha_2)|(x/20<l_alpha_2),alpha=0.3)
0.5425405697091296 1.570521642211546 0.4795388696132433 1.7084803451419166
1.8431801340425595 0.636731117306884 2.085336691906785 0.5853154839290434
<matplotlib.collections.FillBetweenPolyCollection at 0x7fb5db75a1b0>
符号检验 
如果想确定地指导假设是否正确(普通的假设检验有可能得到矛盾的结论
一个例子 
在民意调查中,候选人 A 和 B 的得票情况通过以下方式确定:
- 民意测验 n 个人,得到人群中选 A 的人数 m,以计算选 A 的比例 p。
- 根据比例 p 的值,确定候选人 A 或 B 的胜选情况:
- 如果 p > 0.5,候选人 A 获胜。
- 如果 p < 0.5,候选人 B 获胜。
- 如果 p = 0.5,不能确定胜选情况。
在之前的计算中,1 和 2 之间存在重合的情况。根据 3 确定人数 m 的边界 C1, C2
- 当 C1 < m < C2 时,支持候选人 3。
- 当 m > C2 时,支持候选人 1。
- 当 m < C1 时,支持候选人 2。
- m 服从二项分布 B(n, p)。
n=10000
rv=st.binom(n,0.5)
x=np.arange(rv.ppf(0.001),rv.ppf(0.999))
chi=rv.pmf(x)
plt.plot(x,chi)
print(rv.ppf(0.025),rv.ppf(0.975))
plt.fill_between(x,chi,where=(x>rv.ppf(0.025)) & (x<rv.ppf(0.975)),alpha=0.3)
#binominal variance p*(1-p)*N
print(np.sqrt(0.5*0.5*n)*1.96)
4902.0 5098.0
98.0
根据结果我们可以发现,比 5000 人多不到 100 个人,我们就可以认为 A 胜出了
而二项分布的方差是 $np(1-p)$, 人数少的时候,方差更小