特殊函数 
大数定律与中心极限定理 
切比雪夫不等式:
设随机变量 X 的数学期望和方差存在,分别记为 $\mu$,$\sigma^2$,则对任意的 $\varepsilon>0$, 有
$$ P\{|X-\mu|\ge \varepsilon\}\le\frac{\sigma^2}{\varepsilon^2} $$
辛钦大数定律:
设 $\{X_i,i\ge1\}$为独立同分布的随机变量序列,且数学期望存在,记为 $\mu$,则对任意的 $\varepsilon>0$,有
$$ \lim\limits_{n\rightarrow+\infty}P\{|\frac{1}{n}\sum\limits_{i=1}^nX_i-\mu|\ge\varepsilon\}=0 $$
辛钦大数定律推论:
设 $\{X_i,i>=1\}$ 为独立同分布的随机变量序列,若 $h(x)$ 为一连续函数,且 $E(h(X_i))<+\infty$,则对任意的 $\varepsilon>0$, 有
$$ \lim\limits_{n\rightarrow+\infty}P\{|\frac{1}{n}\sum\limits_{i=1}^nh(X_i)-a|\ge\varepsilon\}=0 $$
其中 $a=E(h(X_i))$
大数定理
- 平均值收敛于期望值
- 频率收敛于概率
中心极限定理 任意同分布的随机变量$X_i$之和,符合正态分布
# -*- coding: utf-8 -*-
import numpy as np
import scipy.stats as st
import matplotlib.pyplot as plt

alambda=2.
fig,ax = plt.subplots(1,2)
yarr=[]
for n in range(50,1000):
    x=st.expon.rvs(0,alambda,size=n)
    y=(sum(x)-n*alambda)/(np.sqrt(n)*alambda)
    yarr.append(y)
ax[0].hist(x,density=True,bins='auto')
bins = np.histogram_bin_edges(yarr, bins='auto')
ax[1].hist(yarr,bins=bins,density=True)
ax[1].plot(bins,st.norm.pdf(bins))
plt.tight_layout()
三大分布 
需要满足 $X_1,X_2,\dots X_n$ 满足正态同分布
(一)$\chi^2$ 分布:
$$ k_n(x) = \frac{1}{\Gamma(\frac{n}{2})2^{\frac{n}{2}}}e^{-x/2}x^{(n-2)/2} $$
设 $X_1,X_2,\ldots,X_n$ 为独立同分布的随机变量,且都服从标准正态分布 $N(0,1)$
记:
$$ Y=X_1^2+X_2^2+\ldots+X_n^2 $$
则称 $Y$ 服从自由度为 n 的 $\chi^2$ 分布,记为 $Y\sim\chi^2(n)$
$\chi^2$ 分布的性质
- $\chi^2(2)=E(\frac{1}{2})$
- 可加性:设 $Y_1\sim\chi^2(m),Y_2\sim\chi^2(n)$,若两者相互独立,则 $Y_1+Y_2\sim\chi^2(m+n)$
- $E(\chi^2(m))=m$,$Var(\chi^2(m))=2m$
- 上 $\alpha$ 分位,可以查表
$$ \begin{equation} (n-1)S^2/\sigma^2 = \sum_{i=1}^{n} (X_i-\bar{X})^2/\sigma^2 \propto \chi_{n-1}^2 \end{equation} $$
import scipy.stats as st
import numpy as np
import matplotlib.pyplot as plt

fig,ax = plt.subplots(2,1)

for df in range(2,20,5):
    x = np.linspace(st.chi2.ppf(0.01,df), st.chi2.ppf(0.99,df),100)
    p=ax[0].plot(x, st.chi2.pdf(x, df),
        label='dof={0:3d}'.format(df))
    k=sum(st.norm.rvs(size=[df,1000])**2) #正态随机变量x,生成df x 1000组,计算Y=df个元素的平方和
    ax[0].hist(k,density=True,alpha=0.6,color=p[0].get_color()) #1000组Y的分布
    ax[1].plot(x/df, st.chi2.pdf(x, df)*df,
        label='dof={0:3d}'.format(df)) #chi2/ndf
ax[0].legend()
ax[1].set(xlabel='x/dof')
ax[0].set(xlabel='x')
fig.tight_layout()
(二)$t$ 分布:
设 $X\sim N(0,1),Y\sim\chi^2(m)$,且 $X,Y$ 相互独立
记:
$$ t=\frac{X}{\sqrt{Y/m}} $$
则称 $t$ 服从自由度为 n 的 $t$ 分布,记为 $t\sim t(n)$
$t$ 分布的性质
- $f_t(x)=f_t(-x)$
- $\lim\limits_{n\rightarrow+\infty}f_t(x)=\frac{1}{\sqrt{2\pi}}e^{-\frac{x^2}{2}}$
$$ \begin{equation} \sqrt{n}(\bar{X}-\mu)/S \propto t_{n-1} \end{equation} $$
t 分布是一个厚尾分布,自由度较低的情况下,尾部要更厚一点
因为 $S$ 中计算的是 $x_i - \bar{x}$,进而丢失了一个自由度,所以 ddof=1
import scipy.stats as st
ndf=10
rv=st.t(ndf)
rv.interval(0.68) # 68置信区间
rv.interval(0.95) # 95置信区间
需要注意的是,上分位点记录的是 $\alpha$, 而累计分布函数是根据 $1-\alpha$ 得来的
自由度为 n 的 t 分布的 0.025 分位点,$\Phi (x)=97.5\%$,记为 $t_n (0.025)$
%matplotlib notebook
from matplotlib.animation import FuncAnimation
import scipy.stats as st

fig, ax = plt.subplots()

x = np.linspace(st.t.ppf(0.01, 5),
                st.t.ppf(0.99, 5), 100)
ax.plot(x,st.norm.pdf(x,0,1),'k+')
line, = ax.plot([])

def animate(df):

    line.set_data((x, st.t.pdf(x,df)))
    line.set_label("Degree of freedom={0:3d}".format(df))
    ax.legend()
    return line

anim = FuncAnimation(fig, animate, frames=20)
plt.show()
# anim.save('test.gif',fps=2,dpi=200)
from IPython.display import HTML
HTML(anim.to_jshtml())
(三)$F$ 分布:
设 $U\sim\chi^2(n_1),V\sim\chi^2(n_2)$,且 $U,V$ 相互独立,则称随机变量
$$ F=\frac{U/n1}{V/n2} $$
服从第一自由度为 $n_1$,第二自由度为 $n_2$ 的 $F$ 分布,记为 $F\sim F(n1,n2)$
$F$ 分布有如下性质:
- 若 $F\sim F(n1,n2)$,则 $1/{F}\sim F(n2,n1)$
- 若 $X\sim t(n)$,则 $X^2\sim F(1,n)$
- $F_{1-\alpha}(n1,n2)=\frac{1}{F_\alpha(n2,n1)}$
- 自由度越高,形状越尖锐,置信区间越小
案例
$$ \begin{equation} \left[ \sum_{i=1}^{m} (Y_i-\bar{Y})^2/\sigma_2^2(m-1)\right] / \left[ \sum_{i=1}^{n} (X_i-\bar{X})^2/\sigma_1^2(n-1)\right] \propto F_{m-1,n-1} \end{equation} $$
from matplotlib.animation import FuncAnimation

fig = plt.figure(figsize=plt.figaspect(0.7))
ax = fig.add_subplot(111)

x = np.linspace(st.f.ppf(0.001, 15, 30),
                st.f.ppf(0.999, 15, 30), 100)

def animate(dfn):
        dfd = dfn+20
        x2 = st.chi2.rvs(dfn,size=10000)/dfn
        x1 = st.chi2.rvs(dfd,size=10000)/dfd
        g=ax.plot(x, st.f.pdf(x, dfn, dfd),label='F({},{})'.format(dfn,dfd))
        ax.hist(x2/x1,bins=x,density=True,alpha=0.6,color=g[0].get_color())
        ax.legend()
def init():
    pass

anim = FuncAnimation(fig, animate, frames=range(15,100,20),repeat=False,init_func=init)
fig.show()
# anim.save('fig2.gif',fps=0.5,dpi=200)
from IPython.display import HTML
HTML(anim.to_jshtml())
$\Gamma$ 函数 
$$ \Gamma(x+1) = x\Gamma(x) $$
若 X 为整数,则 $\Gamma(n)=(n-1)!$
x 为实数时 ($x>0$)
$$ \Gamma(x) = \int_0^{\infty} t^{x-1}e^{-t} dt $$
%matplotlib inline

import numpy as np
import scipy.special as sp
import matplotlib.pyplot as plt

x = np.linspace(0.1, 5.5, 100)
plt.plot(x,sp.gamma(x)) #Gamma函数
k = np.arange(1,6)
plt.plot(k, sp.factorial(k-1), 'k*') #阶乘
[<matplotlib.lines.Line2D at 0x7fcf38d9dac0>]
$\beta$ 函数 
$$ B(x,y) = \int_0^{t} t^{x-1}(1-t)^{y-1}dt,\ (x>0, y>0) $$
$$ B(x,y) = \frac{\Gamma (x) \Gamma (y)} {\Gamma (x+y) } $$
$$ B(x,y) = B(y,x) $$
x, y = np.mgrid[1:5.5:.1, 1:5.5:.1]
#pos = np.dstack((x, y))
fig = plt.figure(figsize=plt.figaspect(0.5))
ax = fig.add_subplot(1, 2, 1, projection='3d')
cmapV='Blues'

ax.plot_surface(x,y,sp.beta(x,y),cmap=cmapV)
ax2 = fig.add_subplot(1, 2, 2)
pos2=ax2.contourf(x, y, sp.beta(x,y),10,cmap=cmapV,alpha=0.5)
cset=ax2.contour(x, y, sp.beta(x,y),10,cmap=cmapV)
ax2.clabel(cset, inline=1, fontsize=10)
fig.colorbar(pos2)
<matplotlib.colorbar.Colorbar at 0x7fcf38ceec00>
---------------------------------------------------------------------------
AttributeError                            Traceback (most recent call last)
File /opt/hostedtoolcache/Python/3.12.4/x64/lib/python3.12/site-packages/matplotlib_inline/backend_inline.py:99, in show(close, block)
     96 # only call close('all') if any to close
     97 # close triggers gc.collect, which can be slow
     98 if close and Gcf.get_all_fig_managers():
---> 99     matplotlib.pyplot.close('all')

File /opt/hostedtoolcache/Python/3.12.4/x64/lib/python3.12/site-packages/matplotlib/pyplot.py:1194, in close(fig)
   1192         _pylab_helpers.Gcf.destroy(manager)
   1193 elif fig == 'all':
-> 1194     _pylab_helpers.Gcf.destroy_all()
   1195 elif isinstance(fig, int):
   1196     _pylab_helpers.Gcf.destroy(fig)

File /opt/hostedtoolcache/Python/3.12.4/x64/lib/python3.12/site-packages/matplotlib/_pylab_helpers.py:81, in Gcf.destroy_all(cls)
     79 for manager in list(cls.figs.values()):
     80     manager.canvas.mpl_disconnect(manager._cidgcf)
---> 81     manager.destroy()
     82 cls.figs.clear()

File /opt/hostedtoolcache/Python/3.12.4/x64/lib/python3.12/site-packages/matplotlib/backends/backend_nbagg.py:144, in FigureManagerNbAgg.destroy(self)
    142 for comm in list(self.web_sockets):
    143     comm.on_close()
--> 144 self.clearup_closed()

File /opt/hostedtoolcache/Python/3.12.4/x64/lib/python3.12/site-packages/matplotlib/backends/backend_nbagg.py:152, in FigureManagerNbAgg.clearup_closed(self)
    148 self.web_sockets = {socket for socket in self.web_sockets
    149                     if socket.is_open()}
    151 if len(self.web_sockets) == 0:
--> 152     CloseEvent("close_event", self.canvas)._process()

File /opt/hostedtoolcache/Python/3.12.4/x64/lib/python3.12/site-packages/matplotlib/backend_bases.py:1189, in Event._process(self)
   1187 def _process(self):
   1188     """Process this event on ``self.canvas``, then unset ``guiEvent``."""
-> 1189     self.canvas.callbacks.process(self.name, self)
   1190     self.guiEvent = None

File /opt/hostedtoolcache/Python/3.12.4/x64/lib/python3.12/site-packages/matplotlib/cbook.py:366, in CallbackRegistry.process(self, s, *args, **kwargs)
    364 except Exception as exc:
    365     if self.exception_handler is not None:
--> 366         self.exception_handler(exc)
    367     else:
    368         raise

File /opt/hostedtoolcache/Python/3.12.4/x64/lib/python3.12/site-packages/matplotlib/cbook.py:110, in _exception_printer(exc)
    108 def _exception_printer(exc):
    109     if _get_running_interactive_framework() in ["headless", None]:
--> 110         raise exc
    111     else:
    112         traceback.print_exc()

File /opt/hostedtoolcache/Python/3.12.4/x64/lib/python3.12/site-packages/matplotlib/cbook.py:361, in CallbackRegistry.process(self, s, *args, **kwargs)
    359 if func is not None:
    360     try:
--> 361         func(*args, **kwargs)
    362     # this does not capture KeyboardInterrupt, SystemExit,
    363     # and GeneratorExit
    364     except Exception as exc:

File /opt/hostedtoolcache/Python/3.12.4/x64/lib/python3.12/site-packages/matplotlib/animation.py:940, in Animation._stop(self, *args)
    938     self._fig.canvas.mpl_disconnect(self._resize_id)
    939 self._fig.canvas.mpl_disconnect(self._close_id)
--> 940 self.event_source.remove_callback(self._step)
    941 self.event_source = None

AttributeError: 'NoneType' object has no attribute 'remove_callback'
四大抽样分布定理 
(一)
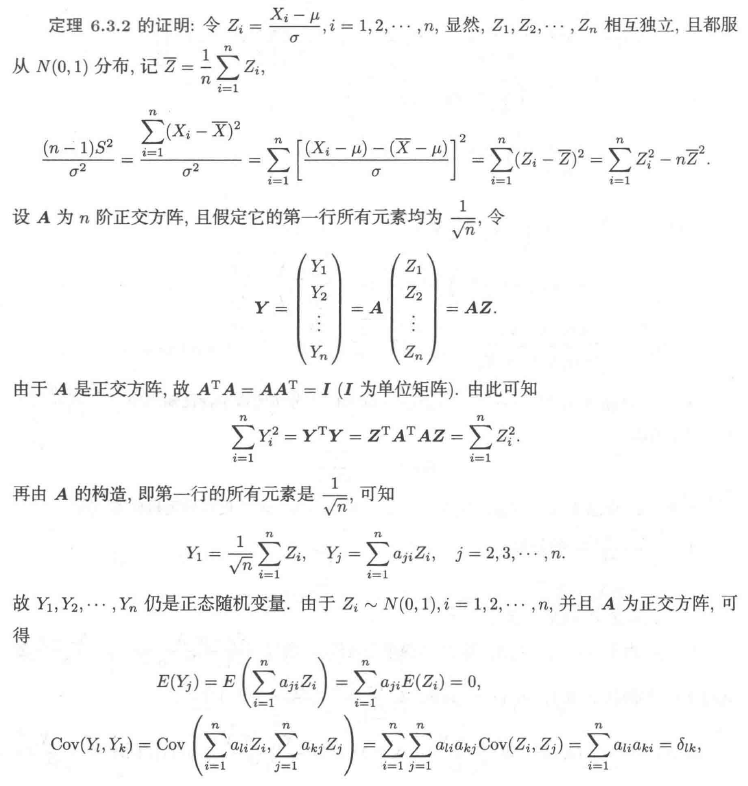
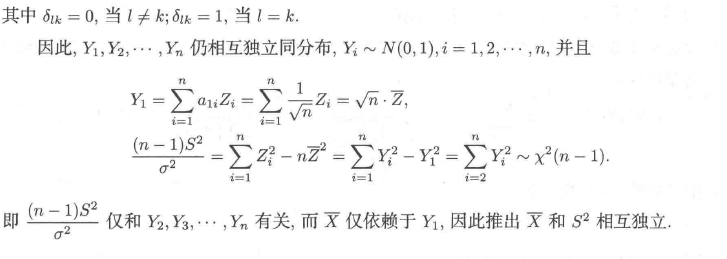
设 $X_1,X_2,\ldots,X_n$ 是来自正态分布总体 $N(\mu,\sigma^2)$ 的简单随机样本,$\bar X$ 是样本均值,$S^2$是样本方差,则
$\bar X \sim N(0,\frac{\sigma^2}{n})$, $\frac{\bar X - \mu}{\sqrt{\frac{\sigma^2}{n}}} \sim N(0,1)$
$\frac{(n-1)S^2}{\sigma^2}\sim\chi^2(n-1)$
$\bar X 与 S^2$相互独立
$\frac{\bar X-\mu}{S/\sqrt{n}}\sim t(n-1)$


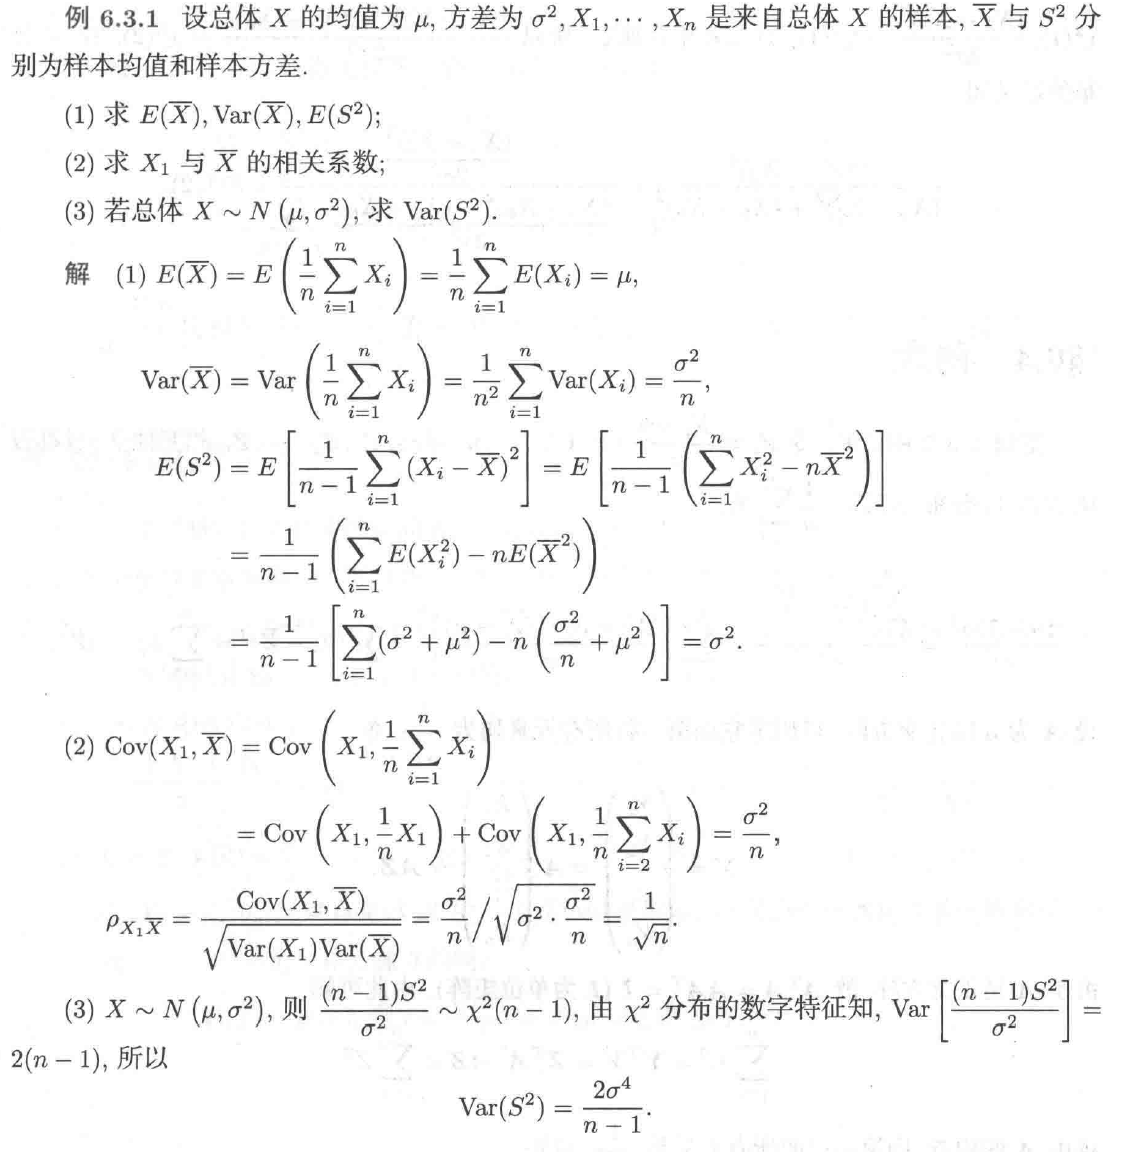
- 记住 $E(X),E(X^2),E(S^2),Var(S^2)$ 的计算方式

(二)
设 $X_1,X_2,\ldots,X_{n1}$ 是来自正态分布总体 $N_1(\mu_1,\sigma^2_1)$ 的简单随机样本 ,$Y_1,Y_2,\ldots,Y_{n2}$ 是来自正态分布总体 $N_2(\mu_2,\sigma^2_2)$ 的简单随机样本 , 样本相互独立 $\bar X,\bar Y$ 是样本均值,$S_1^2,S_2^2$是样本方差,则
$\frac{S^2_1/\sigma^2_1}{S_2^2/\sigma^2_2}\sim F(n1,n2)$
若 $\sigma_1^2=\sigma_2^2=\sigma^2$,
$$ \frac{(\bar X-\bar Y)-(\mu_1-\mu_2) }{S_w\sqrt{\frac{1}{n_1}+\frac{1}{n_2}}} $$
其中
$$ S^2_w=\frac{(n_1-1)S^2_1+(n_2-1)S_2^2}{n_1+n_2-2} $$